Difference between revisions of "Viewer"
(Created page with "Polaris Viewer [Category:Viewer]") |
|||
| (6 intermediate revisions by the same user not shown) | |||
| Line 1: | Line 1: | ||
| − | Polaris Viewer | + | This page describe the Polaris Viewer's interface and major functions of the Viewer. It is intended to help new users familiarize with the Polaris Viewer. Details about how to use a particular function are provided in other pages. |
| − | [Category:Viewer] | + | [[File:Pviewer default v360.png|600px]] |
| + | |||
| + | Above image shows the default Polaris Viewer interface. Similar to other software the menu is on the top. Below the menu is the tool bars. The visibility of different toolbars can be controlled. Each toolbar can be dragged and placed at a preferred location. | ||
| + | |||
| + | Polaris Viewer is inherited from ParaView with some modifications. Most of the descriptions in ParaView User's Manual can be applied to Polaris Viewer. | ||
| + | |||
| + | The "Pipeline Browser" is named in the same way as in ParaView. All the data objects from geometry to results as well as data operations, e.g. slices, are listed in the "Pipeline Browser". When an object is created internally or loaded from a file, it is shown in the "Pipeline Browser". | ||
| + | |||
| + | [[File:Pviewer v360.png|600px]] | ||
| + | |||
| + | Below the "Pipeline Browser" is the "Properties Panel". This panel may have multiple tabs that shows detailed information of the data object. More details about this panel will be provided other pages. | ||
| + | |||
| + | On the right side is the layout of views. This is where the data is displayed. The layout can be split into several views by clicking the horizontal split or vertical split button. See the image below. | ||
| + | |||
| + | |||
| + | [[File:Pviewer_multiple.png|600px]] | ||
| + | |||
| + | A data object can be displayed in multiple views. Only one data object and one view is activated at a time. | ||
| + | |||
| + | [[Category:Viewer]] | ||
Latest revision as of 08:37, 20 July 2015
This page describe the Polaris Viewer's interface and major functions of the Viewer. It is intended to help new users familiarize with the Polaris Viewer. Details about how to use a particular function are provided in other pages.
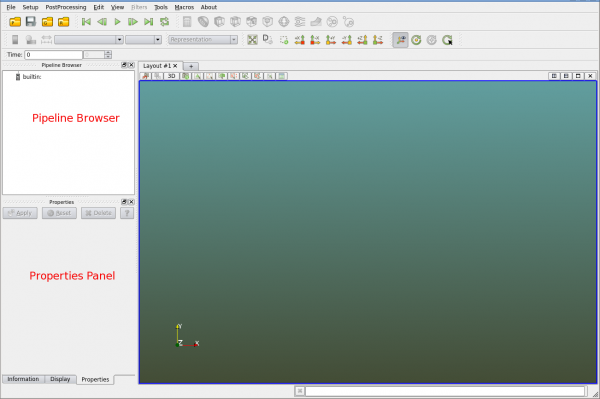
Above image shows the default Polaris Viewer interface. Similar to other software the menu is on the top. Below the menu is the tool bars. The visibility of different toolbars can be controlled. Each toolbar can be dragged and placed at a preferred location.
Polaris Viewer is inherited from ParaView with some modifications. Most of the descriptions in ParaView User's Manual can be applied to Polaris Viewer.
The "Pipeline Browser" is named in the same way as in ParaView. All the data objects from geometry to results as well as data operations, e.g. slices, are listed in the "Pipeline Browser". When an object is created internally or loaded from a file, it is shown in the "Pipeline Browser".
Below the "Pipeline Browser" is the "Properties Panel". This panel may have multiple tabs that shows detailed information of the data object. More details about this panel will be provided other pages.
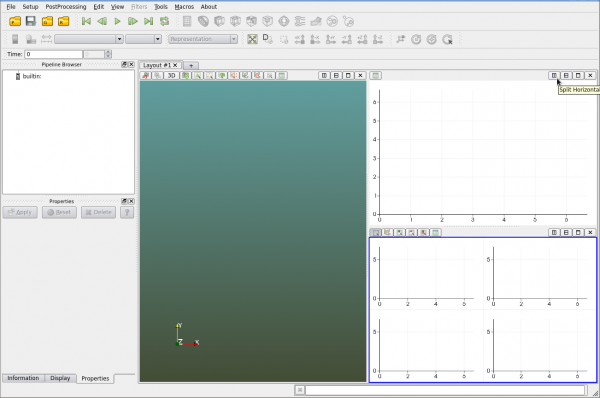
On the right side is the layout of views. This is where the data is displayed. The layout can be split into several views by clicking the horizontal split or vertical split button. See the image below.
A data object can be displayed in multiple views. Only one data object and one view is activated at a time.


