Viewing an object
This page illustrates how to view an object in Polaris Viewer. An object can be a geometry object such as a sphere or an airplane, or a data object such as the fluid flow results. It can also be other objects such as a data table. In this page a geometry object is used to explain some of the major functions in Polaris Viewer.
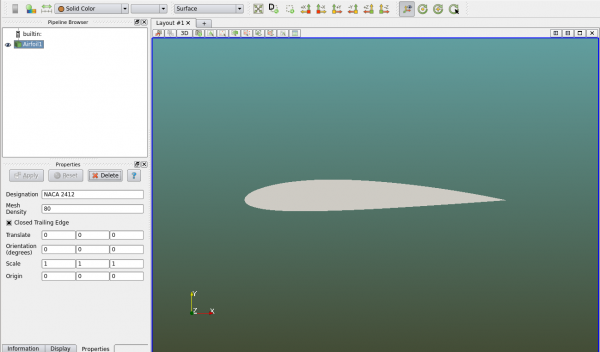
In Polaris Viewer, click on menu "Setup->Create->Airfoil", then click on "Apply" in the "Properties" panel. An airfoil object is seen below. If the "BC" panel is seen on the right side, one can close it since it is not related to this topic.
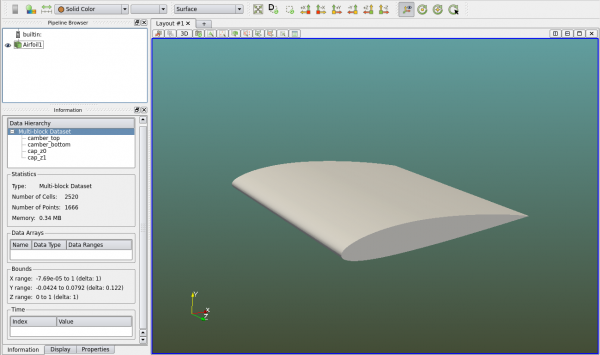
Drag the object in the viewer to rotate it. Then click on the "Information" panel. The "Data Hierarchy" shows this is a "Mulit-block Dataset" and there are four strings under it. Each block in this case is a collection of facets and it is called a face in Polaris. This airfoil has four faces that we will explore later. The "Information" panel also shows the number of cells (facets) and points (vertices) of this object. The X Y Z bounds of the object are also shown.
The "Data Arrays" and "Time" information is empty because this object does not contain such information.
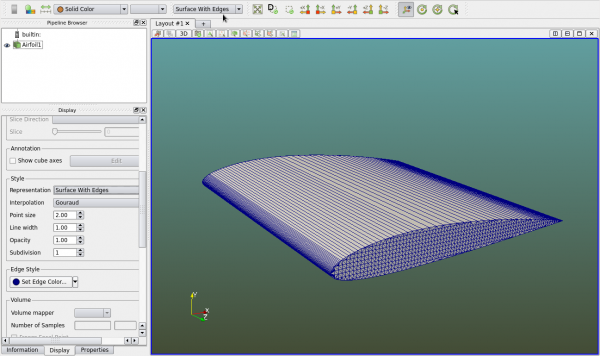
Next click on the "Display" panel and set the "Representation" style to "Surface With Edges". This can also be set in the toolbar below the main menu (see the mouse pointer in the figure below).
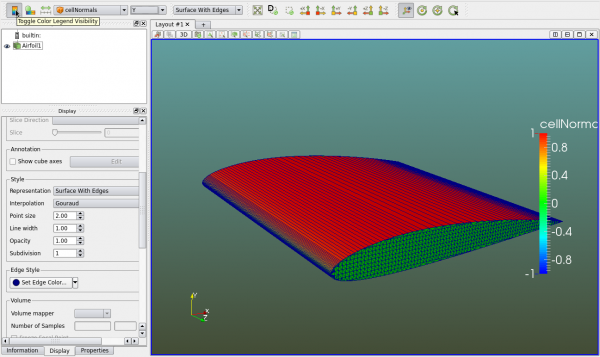
Users can easily inspect the surface normals by setting the object colored by "cellNormals", and picking a normal component, e.g. Y. The color legend can be toggled to be visible as seen in the figure below.
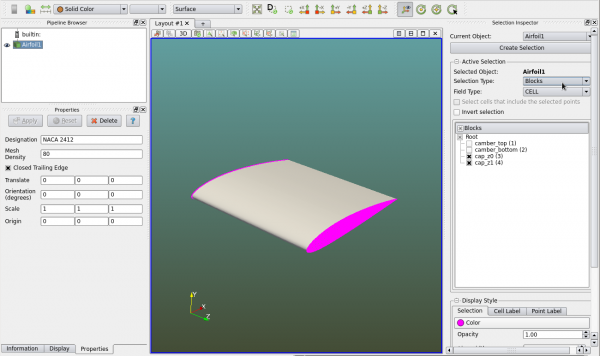
Now set the representation style back to "Surface" and the color to "Solid Color". Click on menu "View->Selection Inspector". The "Selection Inspector" panel is shown. Click on "Create Selection" near the top and set the "Selection Type" to "Blocks". The four blocks (faces) are seen in the list of blocks. Click on any of them to see the block/face to be highlighted in the view area.
